What Analyzing 180,000 Pull Requests Taught Us About Shipping Faster
We last looked at Cycle Time for software engineering to understand what it is and why it matters. Most discussions about Cycle Time end there, leaving a lot of engineering managers frustrated and wanting more. Well-meaning and intelligent engineering managers have theories on which principles drive low cycle time, but very few actually have data to support their hypotheses.
So today we’re going to do just that – we’re going to reveal what we learned about cycle time after analyzing thousands of pull requests from hundreds of teams. In a field full of complexity and nuance, our analysis results were strikingly simple. The primary conclusion we came to was that there’s a single intuitive practice that is highly correlated with low cycle time. But it’s not the one we would have guessed.
The Data
Before we get into exactly our findings, let’s talk briefly about the dataset and definitions we used.
As a refresher, Code Cycle Time (a subset of Cycle Time) represents how long code remains “in flight” – written but not yet deployed.
Our data science team analyzed 180,000 anonymized pull requests from 500 teams, representing about 3,600 contributors. We asked the team to determine what correlation exists, if any, between the following software engineering delivery metrics (we called these “drivers”) and Code Cycle Time:
- Time to Open (Days) (from commit to open)
- Time to Review (Days) (from open to review)
- PR Open to Merge (Days)
- Number of Review Cycles
- % of Abandoned Pull Requests
- Pushes per Day
- Pull Request Throughput per Week
While beyond the scope of this post, they used Locally Weighted Generalized Linear Models (GLM) to determine correlations between drivers.
The Results
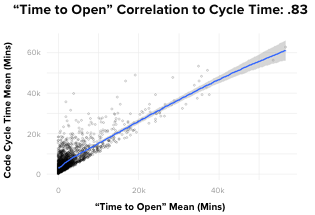
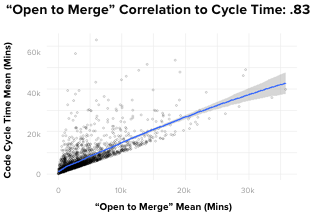
If I had been asked beforehand which of our set of metrics would prove most correlated with cycle time, I would have said, without hesitation, “PR Open to Merge”. Indeed, there is a powerful correlation between these two metrics. However, contrary to what you might think, the data showed that it’s not the most impactful one. Actually, of the drivers we looked at, the metric with the most predictive power on Code Cycle Time was, convincingly, Time to Open.
To give you a better sense of how strong the correlation is, in absolute terms, where a 0 coefficient means “no correlation” and 1 is perfectly correlated, Time to Open and Code Cycle Time had a 0.87 coefficient. This was, in fact, the strongest correlation we found between any two metrics we looked at in our analyses.
Even more striking, Time to Open is more predictive of Code Cycle Time than the length of time the pull request remains open, which means that pull requests that open faster, merge faster.
What can we do with this information?
First, as with most data-driven insights, it can be helpful to marry the results with our intuition.
Code that spends less time on someone’s laptop …
- Is likely small and therefore easier to get reviewed quickly by a single reviewer
- Gets reviewed sooner
- Gets closed sooner if it’s headed in the wrong direction (it happens)
- Signals to other team members the area of the codebase you are working, which can serve to head off painful merge conflicts before they happen
The good news is that Time to Open is a bit easier to influence and understand than the rest of Code Cycle Time, which can get mired in the complexity of collaboration.
Your team probably already hears from you about writing small pull requests, but reinforcing the message helps, and sharing data like the data presented here can help provide transparency and credibility to the recommendation.
One could also consider, carefully and judiciously, whether or not pair programming, in some cases, might improve time to open. This can be particularly helpful for engineers with a tendency (self aware or not) to overthink, overbuild and/or prematurely optimize code.
Closing
The influence of Time to Open on Code Cycle Time is striking. As software engineering professionals, we spend a lot of time discussing ways to optimize and understand the collaborative aspects of software development. This is completely understandable, and does in fact pay dividends. However, the data tells us that in some cases, for some teams, what you should be more likely looking at is your time to open.