Why retro action items fail (and what to do about it)
A retrospective is a time for our team to look back. Its function, however, is to improve the way in which we move forward. Let’s digest the original definition from Scrum:
The Sprint Retrospective is an opportunity for the Scrum Team to inspect itself and create a plan for improvements to be enacted during the next Sprint.
The first two components are activities, the third is a result. And while most teams have fruitful conversations and create action items to yield that result, few have systems in place to ensure that positive change is actually created.
- Inspect ✔
- Create a plan ✔
- Enact improvements 🤷♀️
The problem starts with the notion of “improvement.” It’s both vague and subjective, so any plan of activities feels like a step in the right direction (spoiler: it’s not). If you take measures to concretely define improvement, however, you can hold yourself and your team accountable to your action items. For that, we can use SMART goals.
SMART goals contextualize improvement
Research has shown that goals that are both specific and time-bound are considerably more likely to yield results than generic action items.
Putting a number and a date to each retrospective action item ensures:
- The department understands and aligns on what constitutes success, and
- Progress towards this goal is black and white – trending toward or away from the goal.
While there are plenty of systems that put a number and date to goals, but for the sake of this post, we’ll stick to one that’s tried-and-true: SMART (Specific, Measurable, Achievable, Relevant, Time-bound) goal-setting.

To best position your team to work with SMART goals, you’ll need to adjust all three components of the retro. You’ll be inspecting with more data, creating a plan using SMART goals, and enacting improvements by making progress transparent to everyone on the team.
Inspect: Use data to diagnose the biggest issues
Most teams decide on goals using only qualitative feedback. A team member raises what they perceived to be a large bottleneck, and the whole team immediately starts trying to mitigate that issue. This method gives precedence to what individuals remember and feel, not necessarily the largest and most pressing problems. While personal and andecdotal experience is vital to understanding how a problem affects the whole team, it doesn’t tell the whole story.
If you bring more data points into diagnosing the problem, however, you’re more likely to get a holistic understanding of each bottleneck. Quantitative data helps counteract recency bias and enables you to prioritize based on actual risk that the problems present to your team’s productivity.
Let’s say a given engineering team is trying to diagnose why they didn’t get to as many features as they anticipated this sprint. One engineer, Hannah, makes the following hypothesis:
I feel like there were more pull requests than usual that were open at any one given time. I think it’s because people were too busy to get to code reviews, so work piled up.
Several engineers nod their head. They also noticed that there were more open PRs than usual in GitHub.
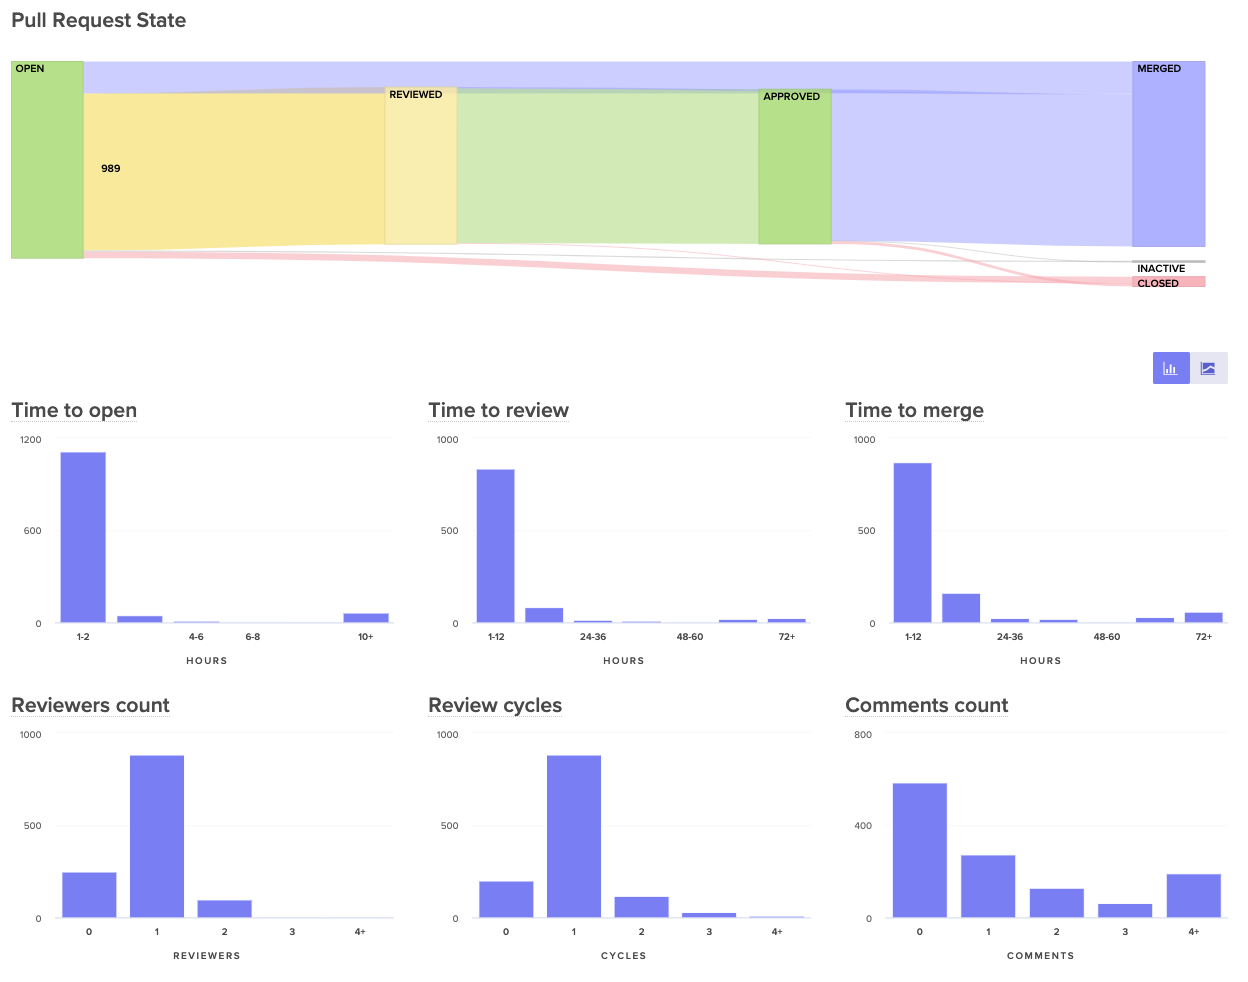
Instead of immediately brainstorming action items, Hannah and her team investigate further. They start by looking at their Time to Review this past sprint, and realize it’s relatively low – just 6 hours. This is contradictory to Hannah’s assessment that the review process was slower than usual. From there, they see that their average number of Review Cycles is about 1.2, where most Pull Requests are approved after one review. Also, seems pretty good.
Finally, they found a red flag when they looked at their Time to Merge. They realize that many pull requests stay open for a long time after they’re reviewed as developers move on to new tracks of work. They then agreed to create a target for open lines of work, so that each team member would only work on one feature at a time.
The gut instinct of the team recognized the symptom– long running pull requests– but not the cause. Without data, they couldn’t have uncovered and addressed a deeper systemic problem.
Other data points you may consider looking at:
- All recent activities, including Pull Requests, Code Reviews, and Tickets, to remind your team of what they worked on last sprint, and where they might have gotten stuck.

- The most important pull requests last sprint. Look at pull requests that had a big effect on the codebase, as well as pull requests that were larger or older than the rest.

- Process metrics including outcome metrics like Cycle Time and Pull Request Throughput, but also metrics that represent more specific areas of the software development process, like Time to Open, Time to Review, and Time to Merge.

Plan: Align with SMART goals
Once your team has fully diagnosed an issue using both qualitative and quantitative data, they’ll have to decide on one, specific metric that they can use as their SMART goal.
Specific
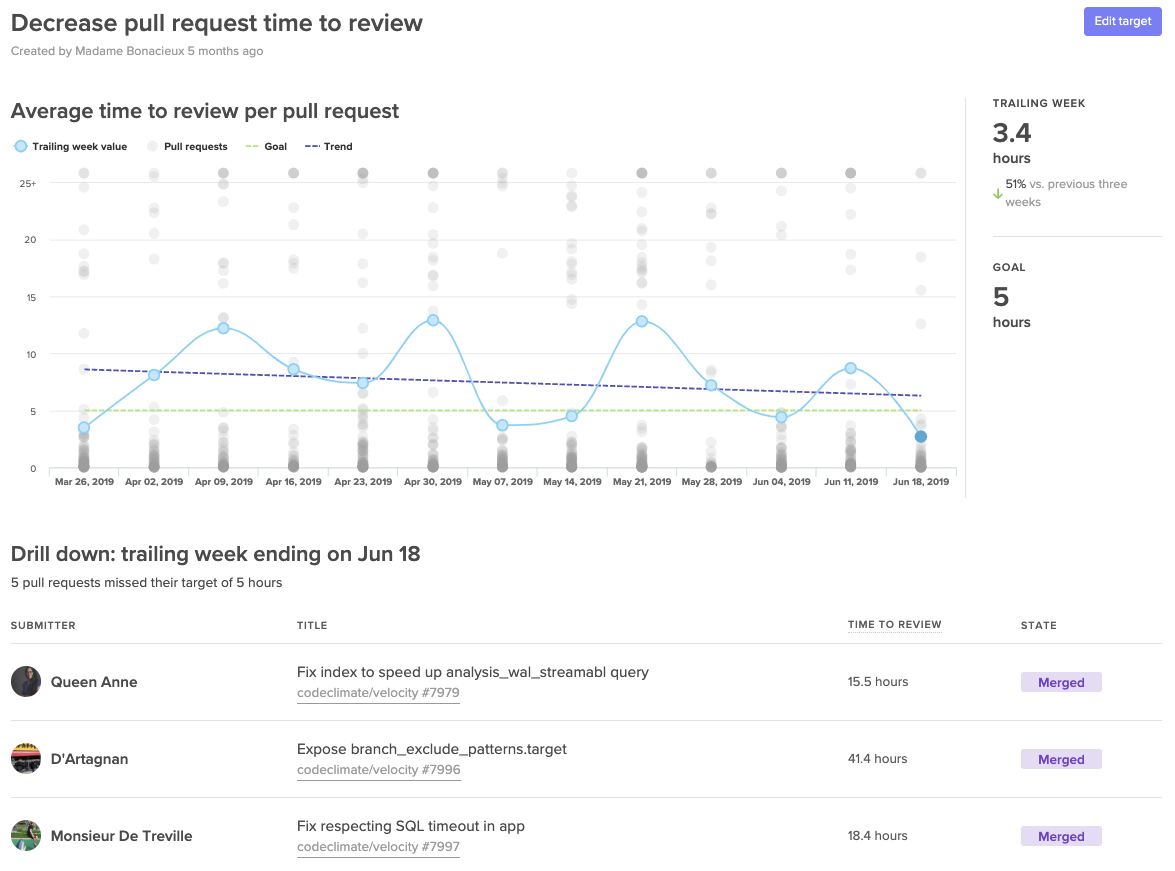
Success of hitting or missing your metric should be black or white, so you need a concrete number in your goal. “Improving our Time to Review” is vague, “Decreasing our Time to Review to under 4 hours” is specific.
Also, make sure the metric is narrow enough that the team knows which behaviors drive this metric up or down. Metrics that are too broad can obscure progress since they’re affected by many different kinds of unrelated data. Hannah’s team, for example, would want to choose a metric like Time to Merge, rather than total Cycle Time, so the team can easily self-correct when they notice the metric trending in a negative direction.
Measurable
The way in which you measure your metric depends on your objective. If you’re measuring output, for example, a simple count can do the trick. If you’re looking to adhere to specific standards– such as keeping pull requests small, or keeping downtime minimal– you’ll want to decide between tracking the simple average and tracking it as a sort of Service Level Objective (SLO) based on a percentile.
Here are a few examples:
While averages are more commonly used in process metrics, SLOs enable your team to deviate from the goal in a few instances without hindering their ability to meet the target.
Assignable
Pick one person to own and track this goal. Research has shown that having exactly one team member check in at regular intervals drastically increases the chances that a goal will be hit. Apple championed the idea of a Directly Responsible Individual (DRI) for all initiatives, and teams at leading tech companies like Microsoft have applied the DRI model to all DevOps related functions.
Ownership will also help you secure buy-in for bringing data into retros. Consider asking the person who uncovered the problem in the first place to own the goal.
Realistic
Make sure your goal is reachable, so your team feels success if they’ve put a concerted effort into reaching the goal.
Execute: Increase visibility to keep goals front of mind
The true test of your action items come after the retro. How frequently will your team think about these metrics? Will success be known across the team? If your team is unsuccessful, will they be able to try a different adjustment?
To keep the goal front of mind, you need to make progress visible to everyone on the team. Many managers use information radars, either in shared spaces or in universally accessible dashboards.

Making progress transparent equips the team to bring the results-oriented discussions outside of their retros. Effective goals will be brought up during standups, 1:1s, and even pairing sessions. Repetition will secure focus and will further unify the team around success.
📈 makes engineers 😊
When Boaz Katz, the founder and CTO of Bizzabo, started setting concrete targets he found that sharing success motivated his team to find more ways to improve. He told us, “My team developed a winning attitude and were eager to ship even faster.”
When the whole team sees success each retro, the momentum creates a flywheel effect. Team members are eager to uncover more improvement opportunities creating a culture around enacting positive change to your processes.