Deciphering Ruby Code Metrics
Ruby has a rich ecosystem of code metrics tools, readily available and easy to run on your codebase. Though generating the metrics is simple, interpreting them is complex. This article looks at some Ruby metrics, how they are calculated, what they mean and (most importantly) what to do about them, if anything.
Code metrics fall into two tags: static analysis and dynamic analysis. Static analysis is performed without executing the code (or tests). Dynamic analysis, on the other hand, requires executing the code being measured. Test coverage is a form of dynamic analysis because it requires running the test suite. We’ll look at both types of metrics.
By the way, if you’d rather not worry about the nitty-gritty details of the individual code metrics below, give Code Climate a try. We’ve selected the most important metrics to care about and did all the hard work to get you actionable data about your project within minutes.
Lines of Code
One of the oldest and most rudimentary forms of static analysis is lines of code (LOC). This is most commonly defined as the count of non-blank, non-comment lines of source code. LOC can be looked at on a file-by-file basis or aggregated by module, architecture layer (e.g. the models in an MVC app) or by production code vs. test code.
Rails provides LOC metrics broken down my MVC layer and production code vs. tests via the rake stats command. The output looks something like this:
+----------------------+-------+-------+---------+---------+-----+-------+
| Name                 | Lines |   LOC | Classes | Methods | M/C | LOC/M |
+----------------------+-------+-------+---------+---------+-----+-------+
| Controllers          |   612 |   513 |      24 |      57 |   2 |     7 |
| Helpers              |   207 |   179 |       0 |      26 |   0 |     4 |
| Models               |  1321 |  1055 |      13 |     188 |  14 |     3 |
| Libraries            |   115 |    98 |       1 |       6 |   6 |    14 |
| Integration tests    |     0 |     0 |       0 |       0 |   0 |     0 |
| Functional tests     |  2693 |  2282 |      19 |      24 |   1 |    93 |
| Unit tests           |  2738 |  2225 |      16 |       4 |   0 |   554 |
+----------------------+-------+-------+---------+---------+-----+-------+
| Total                |  8749 |  7133 |      78 |     326 |   4 |    19 |
+----------------------+-------+-------+---------+---------+-----+-------+
  Code LOC: 1845     Test LOC: 5288     Code to Test Ratio: 1:2.9
Lines of code alone can’t tell you much, but it’s usually considered in two ways: overall codebase size and test-to-code ratio. Large, monolithic apps will naturally have higher LOC. Test-to-code ratio can give a programmer a crude sense of the testing practices that have been applied.
Because they are so high level and abstract, don’t work on “addressing” LOC-based metrics directly. Instead, just focus on improvements to maintainability (e.g. decomposing an app into services when appropriate, applying TDD) and it will eventually show up in the metrics.

Complexity
Broadly defined, “complexity” metrics take many forms:
- Cyclomatic complexity — Also known as McCabe’s complexity, after its inventor Thomas McCabe, cyclomatic complexity is a count of the linearly independent paths through source code. While his original paper contains a lot of graph-theory analysis, McCabe noted that cyclomatic complexity “is designed to conform to our intuitive notion of complexity”.
- The ABC metric — Aggregates the number of assignments, branches and conditionals in a unit of code. The branches portion of an ABC score is very similar to cyclomatic complexity. The metric was designed to be language and style agnostic, which means you could theoretically compare the ABC scores of very different codebases (one in Java and one in Ruby for example).
- Ruby’s Flog scores — Perhaps the most popular way to describe the complexity of Ruby code. While Flog incorporates ABC analysis, it is, unlike the ABC metric, opinionated and language-specific. For example, Flog penalizes hard-to-understand Ruby constructs like meta-programming.
For my money, Flog scores seem to do the best job of being a proxy for how easy or difficult a block of Ruby code is to understand. Let’s take a look at how it’s computed for a simple method, based on an example from the Flog website:
def blah         # 11.2 total =
  a = eval "1+1" # 1.2 (a=) + 6.0 (eval) +

  if a == 2      # 1.2 (if) + 1.2 (==) + 0.4 (fixnum) +
    puts "yay"   # 1.2 (puts)
  end
end
To use Flog on your own code, first install it:
$ gem install flog
Then you can Flog individual files or whole directories. By default, Flog scores are broken out by method, but you can get per-class total by running it with the -g option (group by class):
$ flog app/models/user.rb
$ flog -g app/controllers
All of this raises a question: What’s a good Flog score? It’s subjective, of course, but Jake Scruggs, one of the original authors of Metric-Fu, suggested that scores above 20 indicate the method may need refactoring, and above 60 is dangerous. Similarly, Code Climate will flag methods with scores above 25, and considers anything above 60 “very complex”. Fun fact: The highest Flog score ever seen on Code Climate for a single method is 11,354.
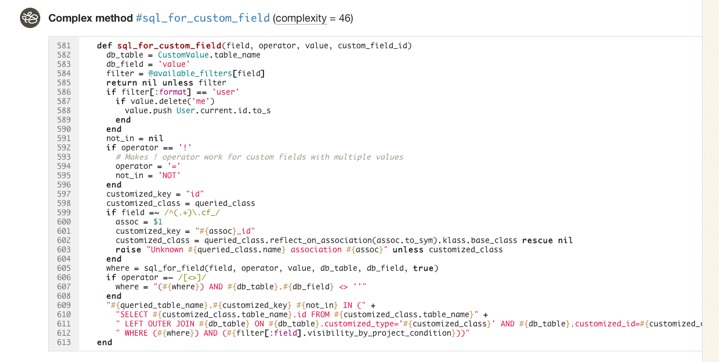
If you’d like to get a better sense for Flog scores, take a look at complex classes in some open source projects on Code Climate. Here, for example, is a pretty complex method inside an open source project:

Like most code smells, high complexity is a pointer to a deeper problem rather than a problem in-and-of itself. Tread carefully in your refactorings. Often the simplest solutions (e.g. applying Extract Method) are not the best and rethinking your domain model is required, and sometimes may actually make things worse.
Duplication
Static analysis can also identify identical and similar code, which usually results from copying and pasting. In Ruby, Flay is the most popular tool for duplication detection. It hunts for large, identical syntax trees and also uses fuzzy matching to detect code which differs only by the specific identifiers and constants used.
Let’s take a look at an example of two similar, but not-quite-identical Ruby snippets:
###### From app/models/tickets/lighthouse.rb:
def build_request(path, body)
  Post.new(path).tap do |req|
    req["X-LighthouseToken"] = @token
    req.body = body
  end
end

####### From app/models/tickets/pivotal_tracker.rb:
def build_request(path, body)
  Post.new(path).tap do |req|
    req["X-TrackerToken"] = @token
    req.body = body
  end
end
The s-expressions produced by RubyParser for these methods are nearly identical, sans the string literal for the token header name, so Flay reports these as:
1) Similar code found in :defn (mass = 78)
  ./app/models/tickets/lighthouse.rb:25
  ./app/models/tickets/pivotal_tracker.rb:25
Running Flay against your project is simple:
$ gem install flay
$ flay path/to/rails_app
Some duplications reported by Flay should not be addressed. Identical code is generally worse than similar code, of course, but you also have to consider the context. Remember, the real definition of the Don’t Repeat Yourself (DRY) principle is:
Every piece of knowledge must have a single, unambiguous, authoritative representation within a system.
And not:
Don’t type the same characters into the keyboard multiple times.
Simple Rails controllers that follow the REST convention will be similar and show up in Flay reports, but they’re better left damp than introducing a harder-to-understand meta-programmed base class to remove duplication. Remember, code that is too DRY can become chafe, and that’s uncomfortable for everyone.
Test Coverage
One of the most popular code metrics is test coverage. Because it requires running the test suite, it’s actually dynamic analysis rather than static analysis. Coverage is often expressed as a percentage, as in: “The test coverage for our Rails app is 83%.”
Test coverage metrics come in three flavors:
- C0 coverage — The percentage of lines of code that have been executed.
- C1 coverage — The percentage of branches that have been followed at least once.
- C2 coverage — The percentage of unique paths through the source code that have been followed.
C0 coverage is by far the most commonly used metric in Ruby. Low test coverage can tell you that your code in untested, but a high test coverage metric doesn’t guarantee that your tests are thorough. For example, you could theoretically achieve 100% C0 coverage with a single test with no assertions.
To calculate the test coverage for your Ruby 1.9 app, use SimpleCov. It takes a couple steps to setup, but they have solid documentation so I won’t repeat them here.
So what’s a good test coverage percentage? It’s been hotly debated. Some, like Robert Martin, argue that 100% test coverage is a natural side effect of proper development practices, and therefore a bare minimum indicator of quality. DHH put forth an opposing view likening code coverage to security theater and expressly discouraged aiming for 100% code coverage.
Ultimately you need to use your judgement to make a decision that’s right for your team. Different projects with different developers might have different optimal test coverage levels throughout their evolution (even if they are not looking at the metric at all). Tune your sensors to detect pain from under-testing or over-testing and adjust your practices based on pain you’re experiencing.
Suppose that you find yourself with low coverage and are feeling pain as a result. Maybe deploys are breaking the production website every so often. What should you do then? Whole books have been written on this subject, but there are a few tips I’d suggest as a starting point:
- Test drive new code.
- Don’t backfill unit tests onto non-TDD'ed code. You lose out on the primary benefits of TDD: design assistance. Worse, you can easily end up cementing a poor object design in place.
- Start with high level tests (e.g. acceptance tests) to provide confidence the system as a whole doesn’t break as you refactor its guts.
- Write failing tests for bugs before fixing them to protect agains regressions. Never fix the same bug twice.
Churn
Churn looks at your source code from a different dimension: the change of your source files over time. I like to express it as a count of the number of times a class has been modified in your version control history. For example: “The User class has a churn of 173.”
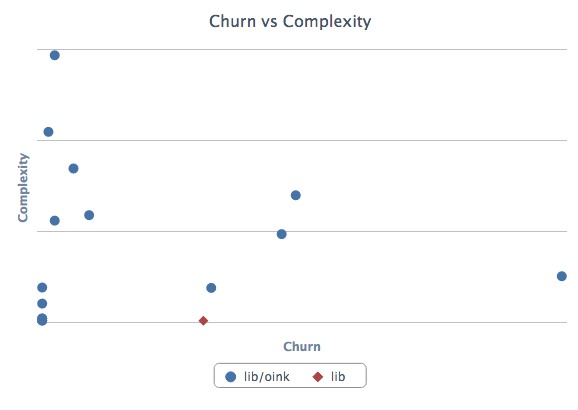
By itself, Churn can’t tell you much, but it’s powerful if you mix it with another metric like complexity. Turbulence is a Gem that does just that for Ruby projects. It’s quite easy to use:
$ gem install turbulence
$ cd path/to/rails_app && bule
This will spit out a nice report in turbulence/turbulence.html. Here’s an example:

Depending on its complexity and churn, classes fall into one of four quadrants:
- Upper-right — Classes with high complexity and high churn. These are good top priorities for refactoring because their maintainability issues are impacting the developers on a regular basis.
- Upper-left — Classes with high complexity and low churn. An adapter to hook into a complex third-party system may end up here. It’s complicated, but if no one has to work on (or debug) that code, it’s probably worth leaving as-is for now.
- Lower-left — Classes with low churn and low complexity. The best type of classes to have. Most of your code should be in this quadrant.
- Lower-right — Classes with low complexity and high churn. Configuration definitions are a prototypical example. Done right, there’s not much to refactor here at all.
Wrapping Up
Ruby is blessed with a rich ecosystem of code metrics tools, and the gems we looked at today just scratch the surface. Generally, the tools are easy to get started with, so it’s worth trying them out and getting a feel for how they match up (or don’t) with your sense of code quality. Use the metrics that prove meaningful to you.
Keep in mind that while these metrics contains a treasure trove of information, they represent only a moment in time. They can tell you where you stand, but less about how you got there and where you’re going. Part of the reason why I built Code Climate is to address this shortcoming. Code Climate allows you to track progress in a meaningful way, raising visibility within your team:

If you’d like to try out code quality metrics on your project quickly and easily, give Code Climate a try. There’s a free two week trial, and I’d love to hear your feedback on how it affects your development process.
There’s a lot our code can tell us about the software development work we are doing. There will always be the need for our own judgement as to how our systems should be constructed, and where risky areas reside, but I hope I’ve shown you how metrics can be a great start to the conversation.