Turning on the lights
An introduction to Data-Driven Engineering
Welcome to the first installment of Code Climate’s new “Data-Driven Engineering” series. Since 2011, we’ve been helping thousands of engineering organizations unlock their full potential. Recently, we’ve been distilling that work into one unified theme: Data-Driven Engineering.
What’s Data-Driven Engineering?
Data-Driven Engineering applies quantitative data to improve processes, teams, and code. Importantly, Data-Driven Engineering is not:
- Ignoring qualitative data you don’t agree with
- Replacing collaboration and conversations
- Stack ranking or micromanaging developers
Why is this important?
Data-Driven Engineering offers significant advantages compared to narrative-driven approaches. It allows you to get a full picture of your engineering process, receive actionable feedback in real-time, and identify opportunities for improvement through benchmarking. Most importantly, quantitative data helps illuminate cognitive biases, of which there are many.

What can Data-Driven Engineering tell us?
After analyzing our anonymized, aggregated data set including thousands of engineering organizations, the short answer is: a lot.
Over the coming weeks, we’ll explore unique and practical insights to help you transform your organization. We’ll share industry benchmarks for critical engineering velocity drivers to help our readers identify process improvement opportunities. Here’s an example:

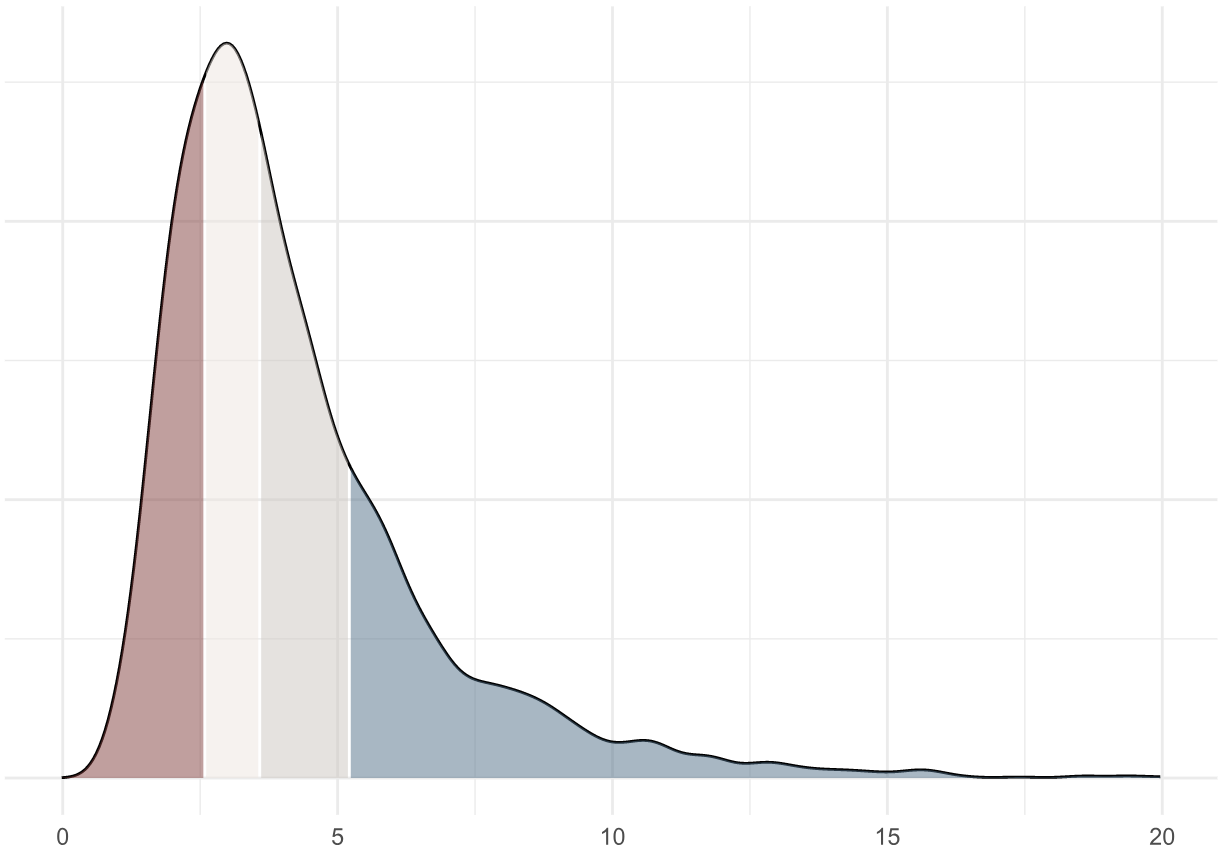
This plot shows that an average engineer merges 3.6 pull requests per week, and a throughput above 5.2 PRs merged per week is in the upper quartile of our industry benchmark.
You might be thinking, “Why do some engineers merge almost 50% more than their peers?”… and that’s exactly the type of questions Data-Driven Engineering can help answer.
1 We included contributors who average 3+ coding days per week from commit timestamps.