A new, clearer way to understand code quality
It’s been six years since Code Climate introduced radically simple metrics for code quality: a grade point average (GPA) from 0 to 4.0 for repositories, and a letter rating for every file. Today, we’re going further by completely revamping the way we measure and track quality, and shipping a bunch of new features to go along with it.
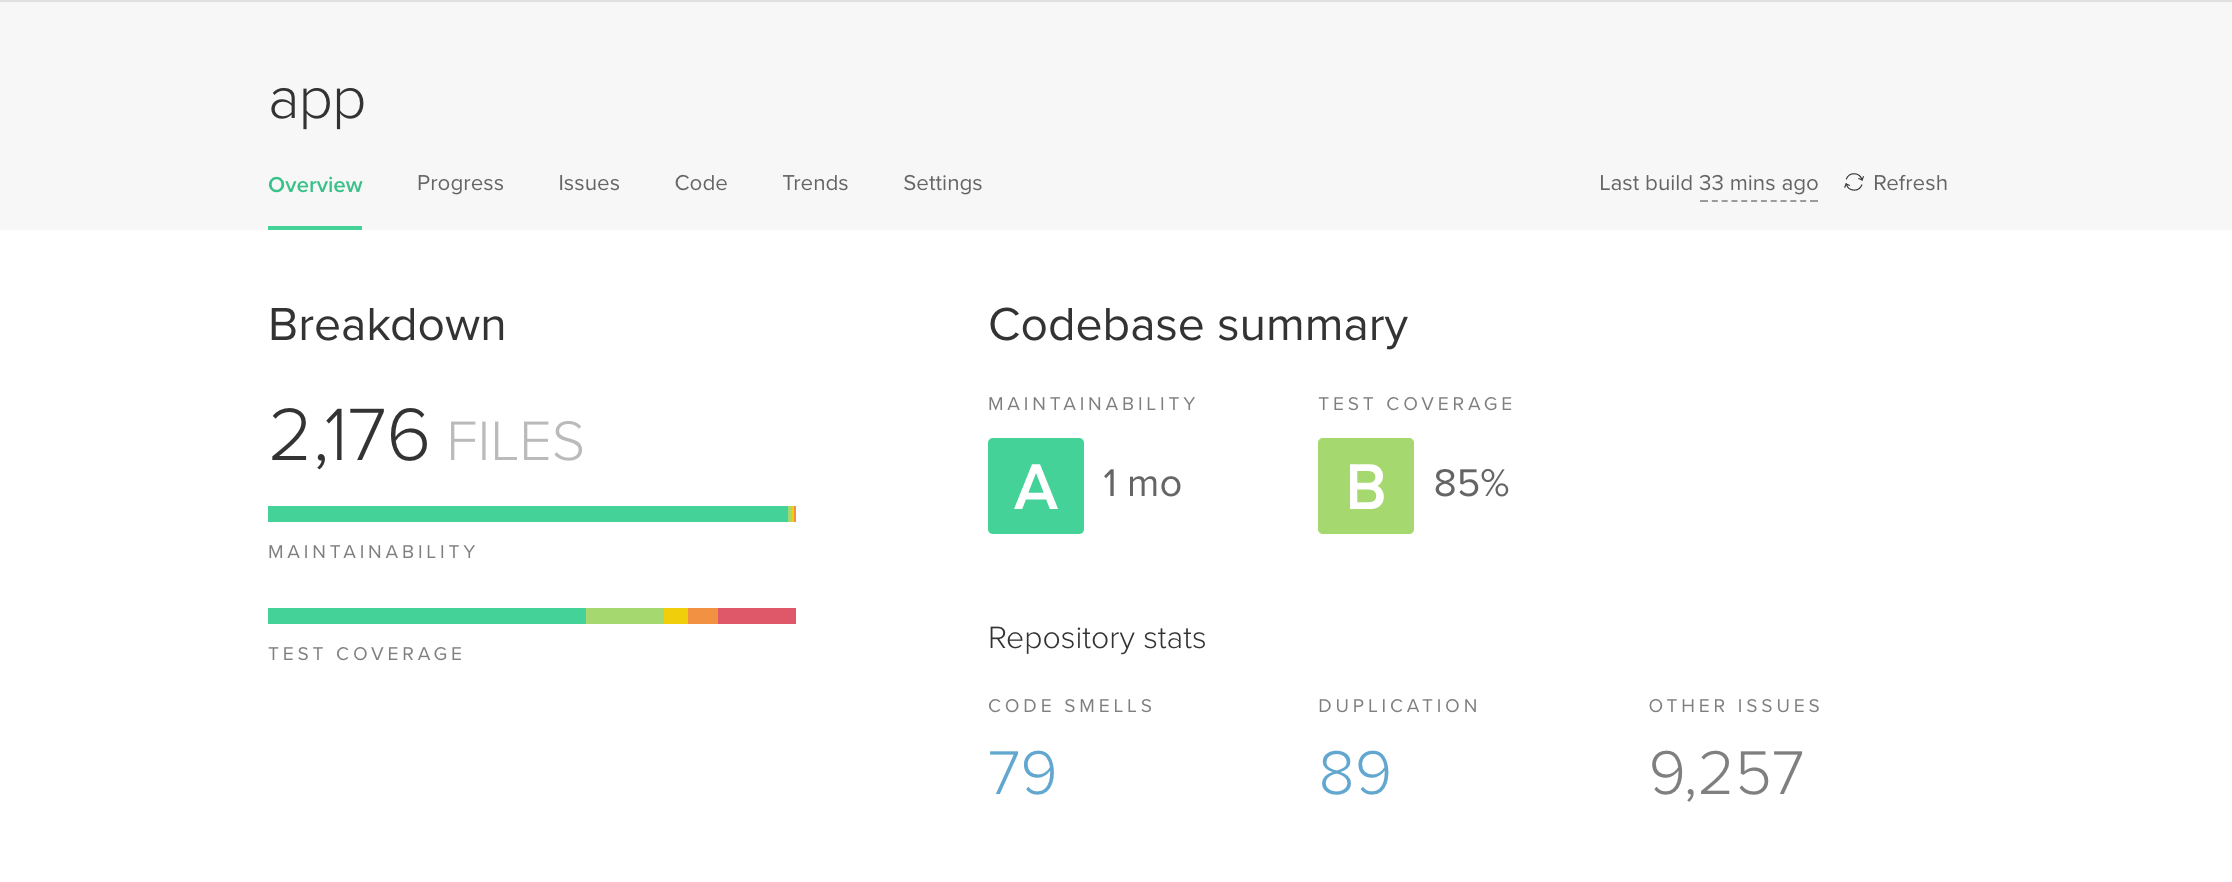
Every repository and file will now receive two top-level ratings:
Maintainability: An estimate of technical debt in the repo based on our standardized 10-point assessment which looks at duplication, complexity and structural issues.
Test Coverage: The percentage of covered lines compared to the total number of lines of code. (We ingest test coverage information from your continuous integration server using our new universal test reporter.)
Here’s how it all comes together on your new repository Overview page:
On top of this foundation, we’re launching five major, new features:
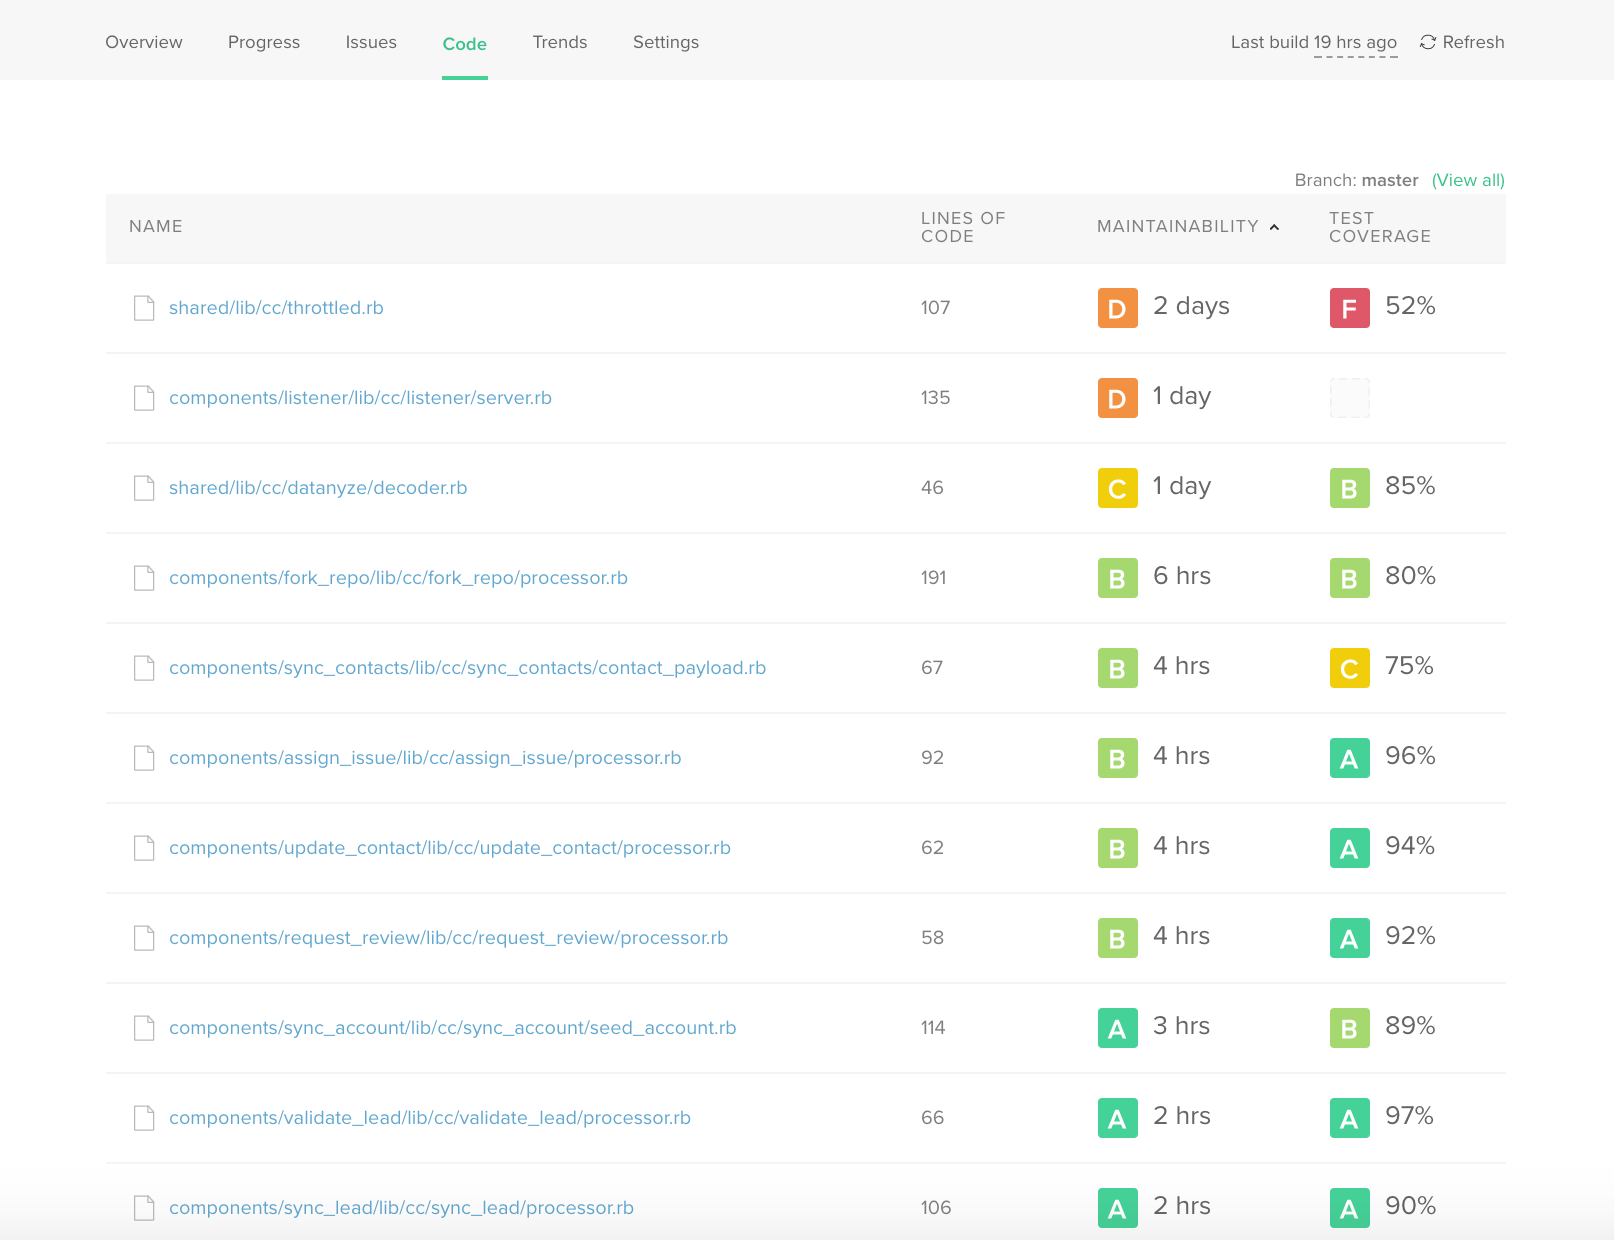
Unified Code tab with maintainability and test coverage side-by-side
Gone is the isolated Test Coverage tab, which was an additional place to get a full view of your overall quality. We’ve fully integrated test coverage information into the Code tab, and everywhere else.
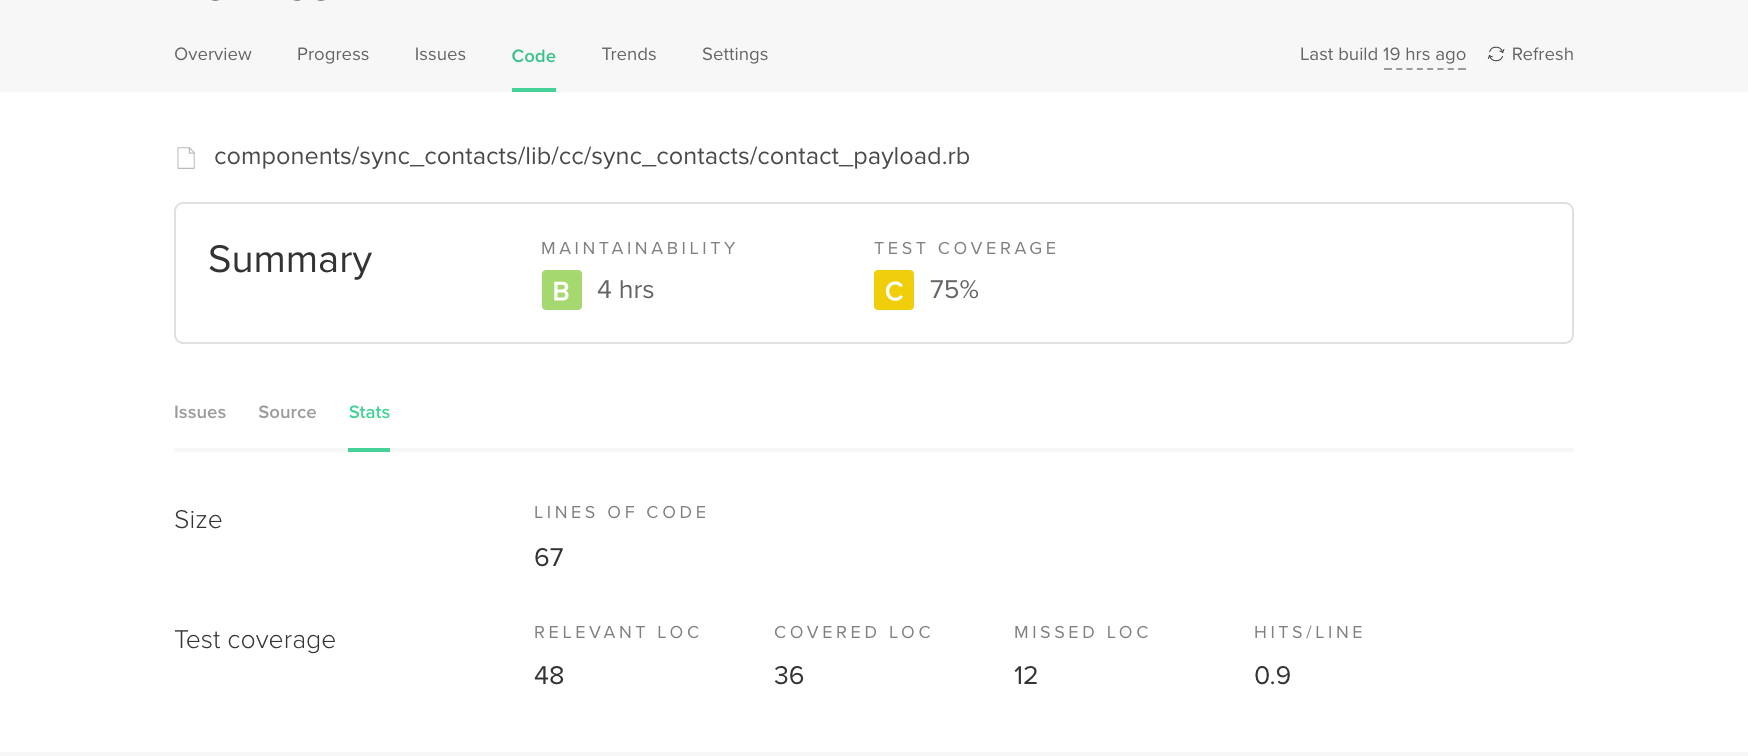
Drilling down, you can access per-file quality statistics on the new Stats sub-tab:
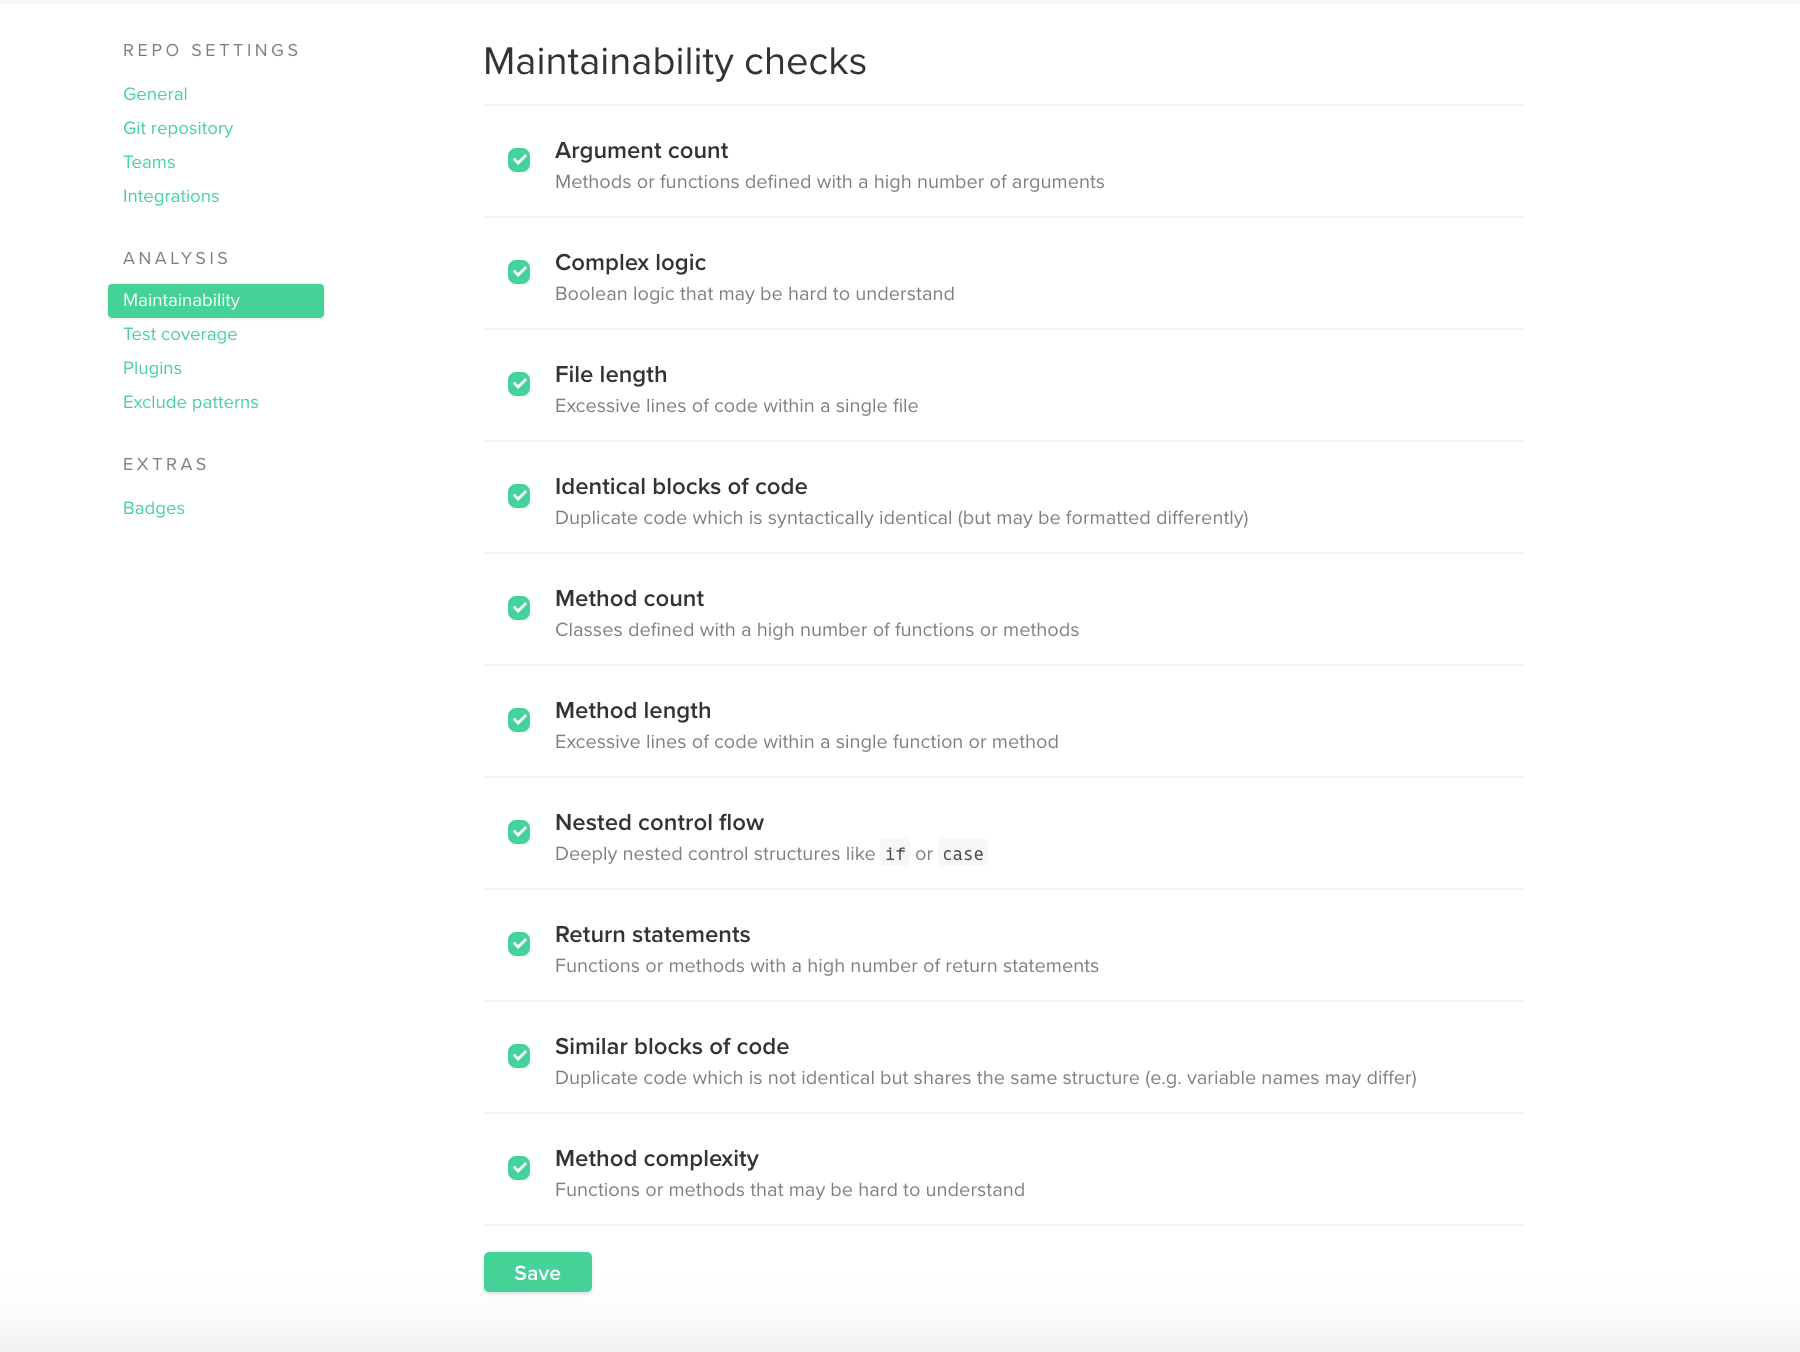
In-app configuration of code quality analysis
It’s now possible to control the way we analyze your code quality using simple, in-app configuration. Easily select which checks to run and exclude files that are not relevant.
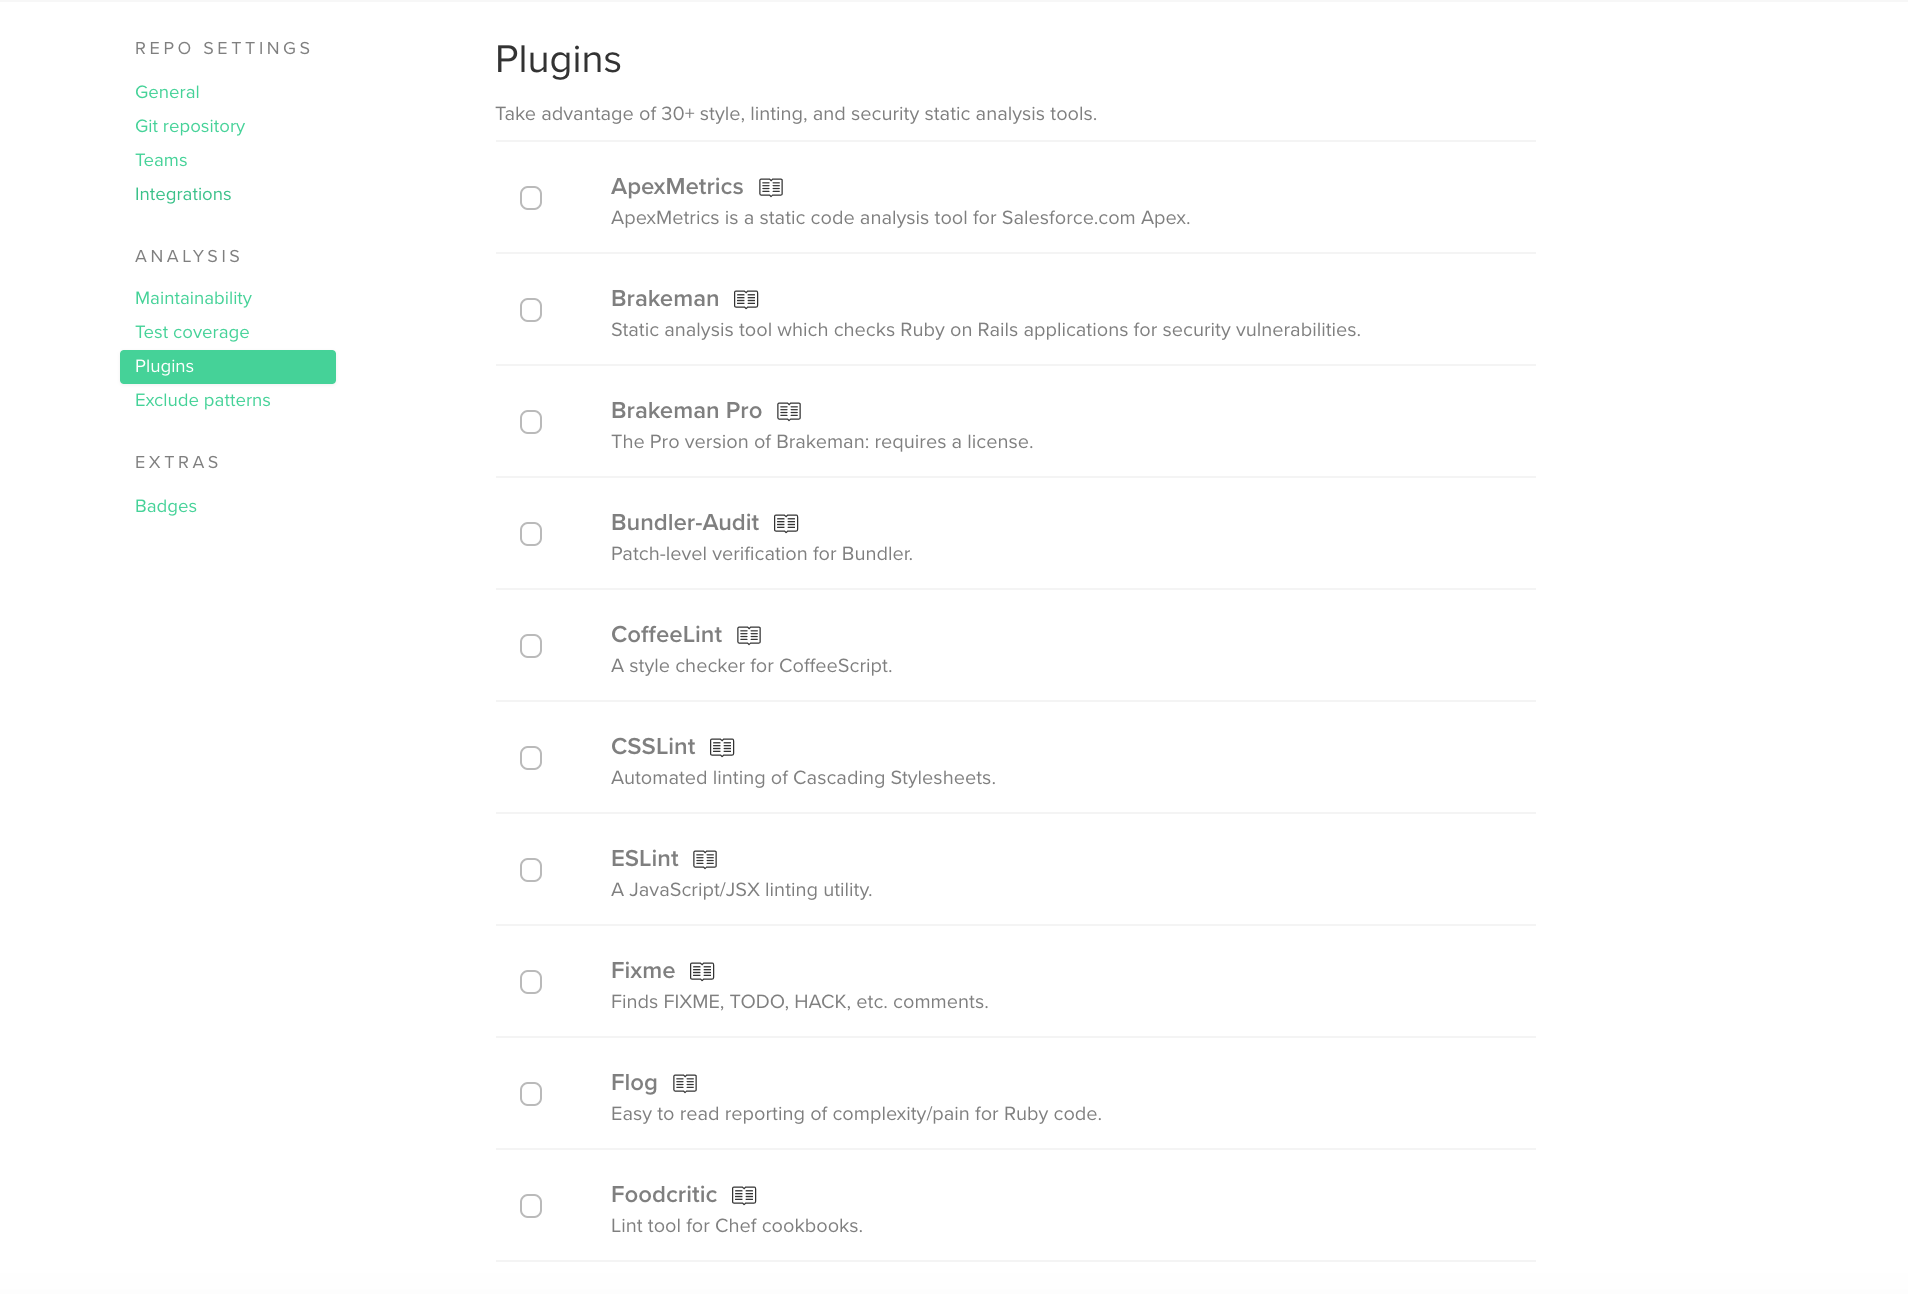
You can also easily browse and enable open source static analysis plugins, taking advantage of the 30+ tools that are compatible with our open, extensible platform.
For those who prefer finer-grained control, or wish to keep their configuration in version control,
file-based configuration using .codeclimate.yml remains available. If checked in, the
.codeclimate.yml takes precedence over the in-app configuration.
Reorganized and expanded Trends area
With all this new data available, we thought it was a great time to add some organization to the Trends tab. The left sidebar now makes it easy to get right to what you’re looking for.
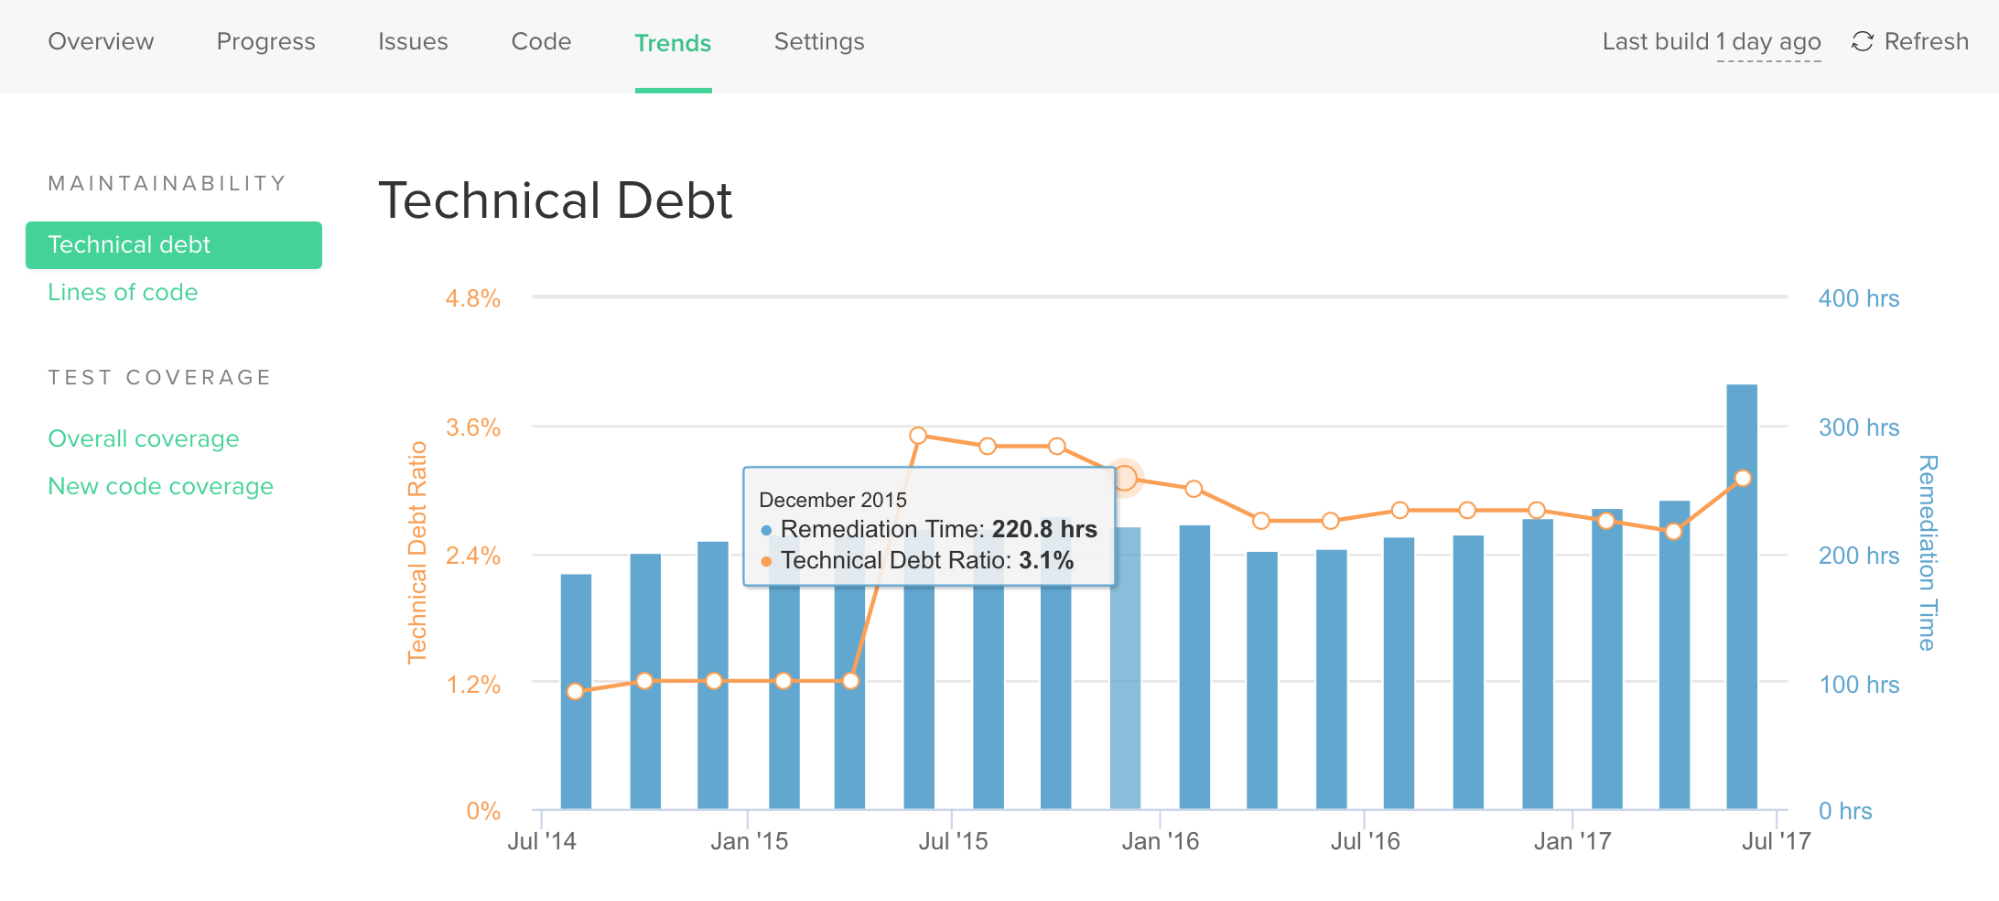
We’ve also added a new chart allowing you to see the total amount of technical debt in the project, and the overall project maintainability, all in one place.
Improved quality alerts via Slack and email
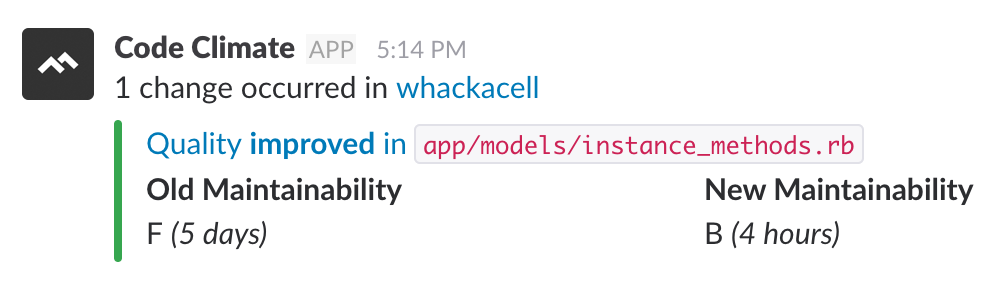
Our pass/fail pull request statuses are great for ensuring that every change merged into your codebase meets your quality standards. However, every once in awhile something may slip through the cracks. For these situations, we’ve revamped the quality alerts we send via both Slack and email. Here’s what it looks like in Slack:
And an email reporting some test coverage changes:
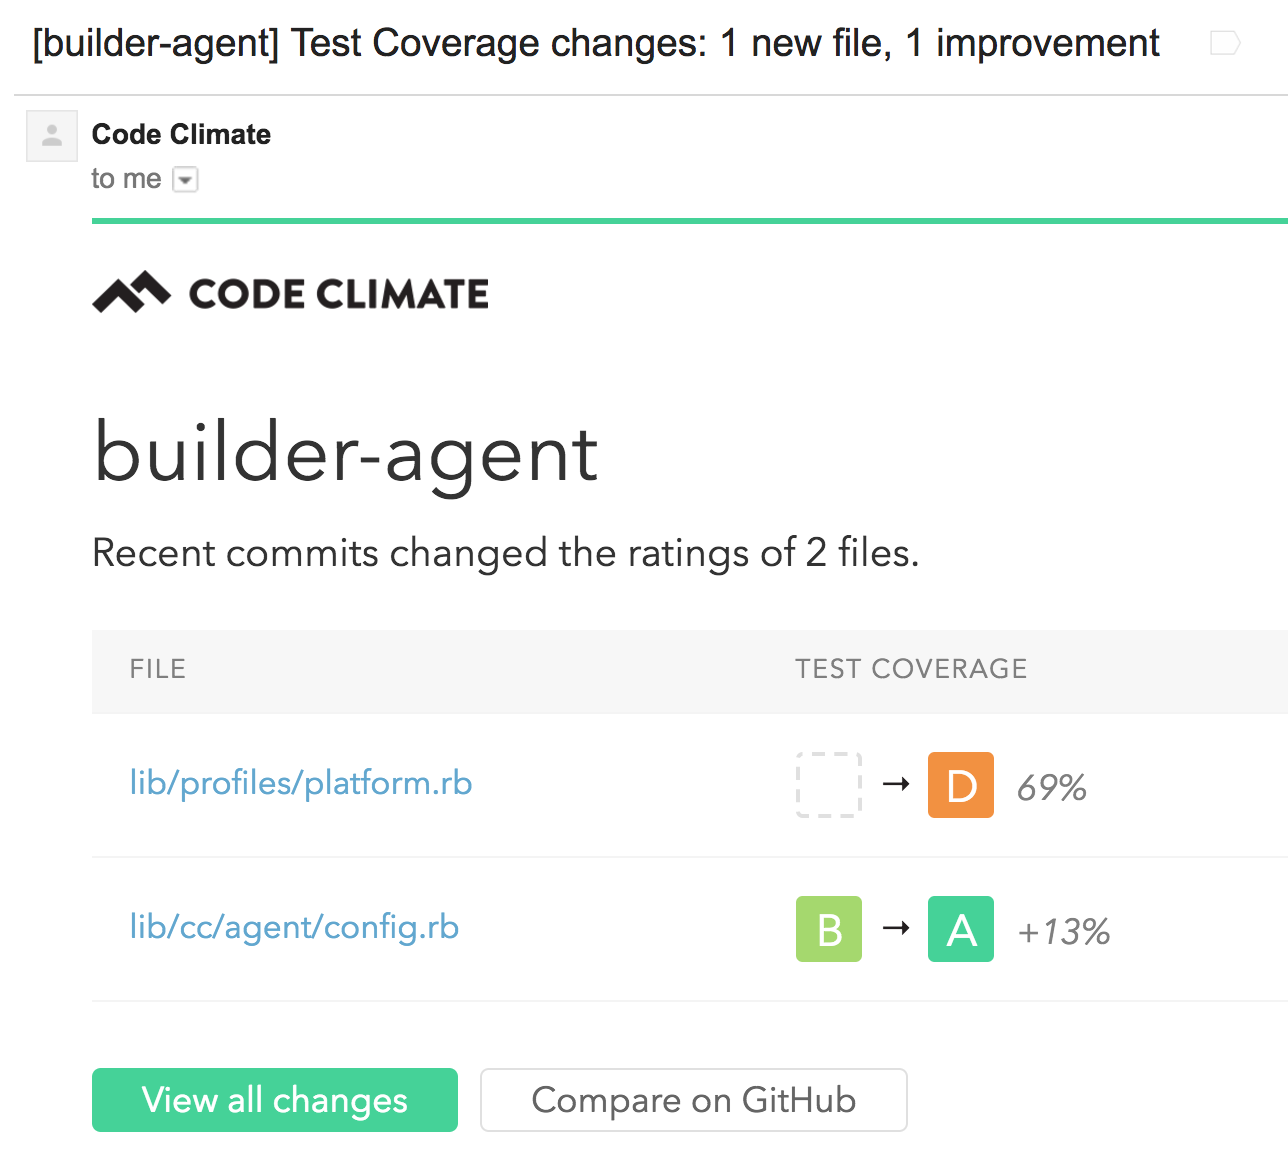
Alerts are sent when any letter rating changes, or any new files are created with “C” or lower ratings. We think this new functionality is an excellent complement to our recently-launched customizable issue alerts.
All of the above and more available via a REST API
OK, so this one isn’t completely new, but it’s gotten much better and we couldn’t resist including it. Over the past year we’ve been developing Code Climate with an API-first methodology. As a result, the data that powers all of the above features is available over a robust REST API for you to take advantage of as you see fit. Here’s a few examples:
Get the current ratings for an individual file
$ curl \
  https://api.codeclimate.com/v1/repos/:repo_id/ratings \
  -H "Accept: application/vnd.api+json" \
  -H "Authorization: Token token=<token>" |
  jq '.data | .[] | select(.attributes.path == "path/to/file.rb")'
{
  "id": "59c41d36d0c53d0001000001",
  "type": "ratings",
  "attributes": {
    "path": "path/to/file.rb",
    "letter": "A",
    "measure": {
      "value": 220,
      "unit": "minute"
    },
    "pillar": "Maintainability"
  }
}
{
  "id": "59c41d36d0c53d0001000002",
  "type": "ratings",
  "attributes": {
    "path": "path/to/file.rb",
    "letter": "A",
    "measure": {
      "value": 92.40506329113924,
      "unit": "percent"
    },
    "pillar": "Test Coverage"
  }
}
Get a time-series of test coverage information
$ curl \
  https://api.codeclimate.com/v1/repos/:repo_id/metrics/test_coverage \
  -X GET \
  -H "Authorization: Token token=<token> \
  -H "Accept: application/vnd.api+json" \
  --data-urlencode "filter[from]=2017-08-01" \
  --data-urlencode "filter[to]=2017-09-01" |
  jq
{
  "data": {
    "id": "59c41d36d0c53d0001000001",
    "type": "metrics",
    "attributes": {
      "name": "test_coverage",
      "points": [
        {
          "timestamp": 1501459200,
          "value": 98.57142857142858
        },
        {
          "timestamp": 1502064000,
          "value": 98.50960160504442
        },
        {
          "timestamp": 1502668800,
          "value": 98.53490376328641
        },
        {
          "timestamp": 1503273600,
          "value": 98.53314527503527
        },
        {
          "timestamp": 1503878400,
          "value": 98.5405557114791
        }
      ]
    }
  }
}
Just head over to your API access page of your user settings area to generate a personal access token and get started.
These features will be rolled out to all repositories on CodeClimate.com starting today.
Wrapping Up
We hope you’ll agree that these changes represent a dramatic leap forward for Code Climate. As we’ve been testing this functionality internally and with a small group of customers, we’ve found it really changes the way we interact with code quality information day-to-day.
There may be a few rough edges as we refine and polish some areas. As always, if you have any questions about anything, please don’t hesitate to get in touch. Our fantastic support team is always here to help.