Springbuk used metrics to scale continuous delivery.

Industry: Health Intelligence
Company size: 250+
The Challenge

Leadership wanted to start growing the engineering team.

Roger Deetz was brought on as the VP of engineering to help build out the engineering department. But after a few weeks of getting caught up to speed, Roger realized the engineering org’s processes were not prepared for scale.

There was little consistency in how teams shipped feature to end-customers. “We had all the pitfalls of agile, but none of the benefits,” remarked one of the engineering team members. Engineers were juggling multiple tracks of work, and some work would get stuck in the pipeline for weeks. Other teams had no process around continuous delivery at all. "We had ambitious hiring goals, but no system to ensure that the new talent would be successful and productive in their role,” Roger told us.

Before tackling hiring and expanding the engineering team, Roger decided to double down on process.

The Solution

Roger used Velocity to create a blueprint for better Agile processes across the org.

Roger was skeptical of engineering metrics. He told us, “Metrics like lines of code or tickets closed aren’t that meaningful because they tend to reward being busy, not necessarily working smart.” But he was willing to try Velocity because he was eager to try anything that would help him determine whether process changes were effective.

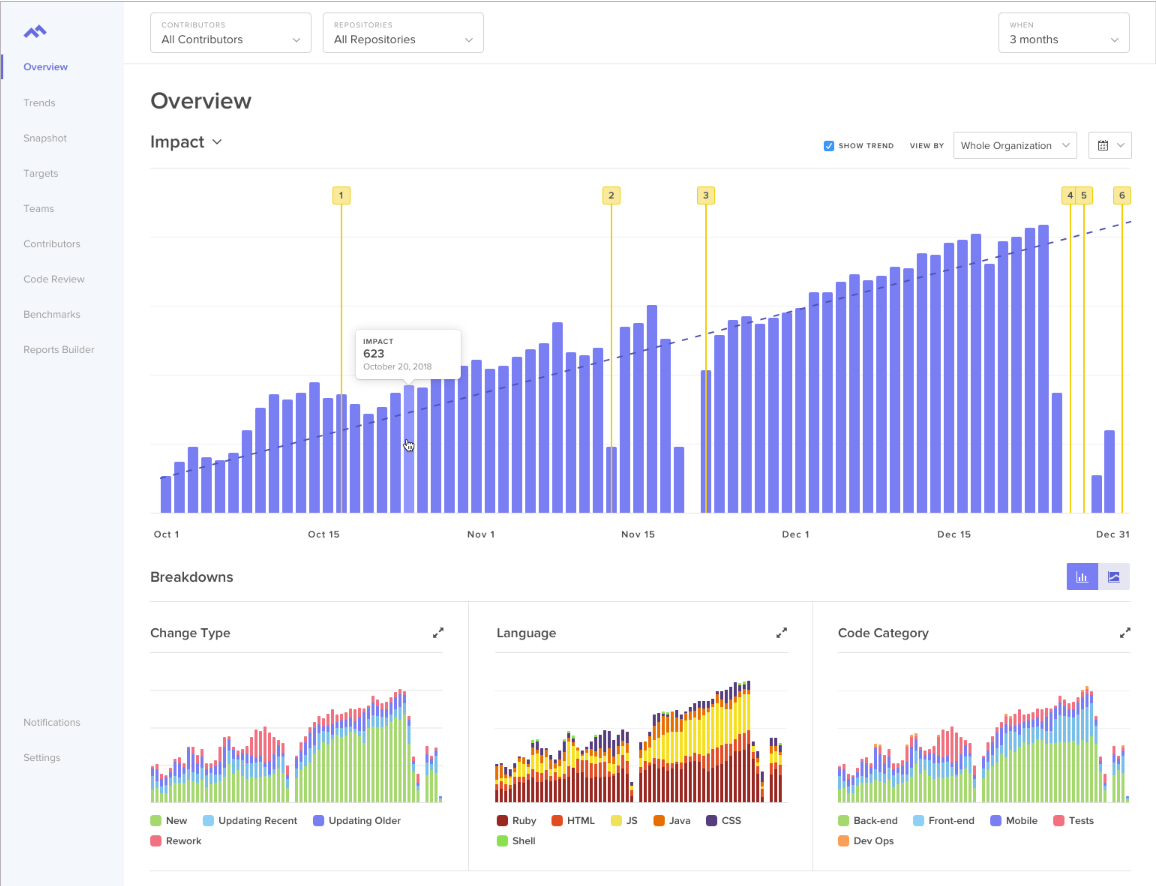
Roger started using Velocity on a weekly basis, looking at Pull Request Throughput and Cycle Time. Velocity let Roger compare these metrics across teams to easily distinguish which teams were highly productive. Roger tells us, “Although I was skeptical at first, I’m now a true believer in Velocity metrics. Measurement helped us find focus. We saw what agile practices were working and shared them across teams.”

One of Roger’s findings was that less efficient teams experienced a lack of clarity around stories. Engineers were often working with vague stories causing lengthy review cycles and misalignment within engineering about what they were working on.

Roger worked with his engineering leads and product managers to create a standard for stories. Product and Engineering teams were encouraged to come up with 1-sentence actionable requests and decompose projects estimated above 20 effort points into a set of smaller, independent stories.

With stronger processes in place, Roger felt that he could confidently set out to scale his engineering department.

I encourage any engineering leader to start measuring with Velocity to discover their team’s successful work habits.
Roger Deetz
VP of Engineering, Springbuk
Results

Data drives concrete improvement.

64% increase in Pull Request Throughput.

48% decrease in Cycle Time.

91% decrease in Pull Request Size.

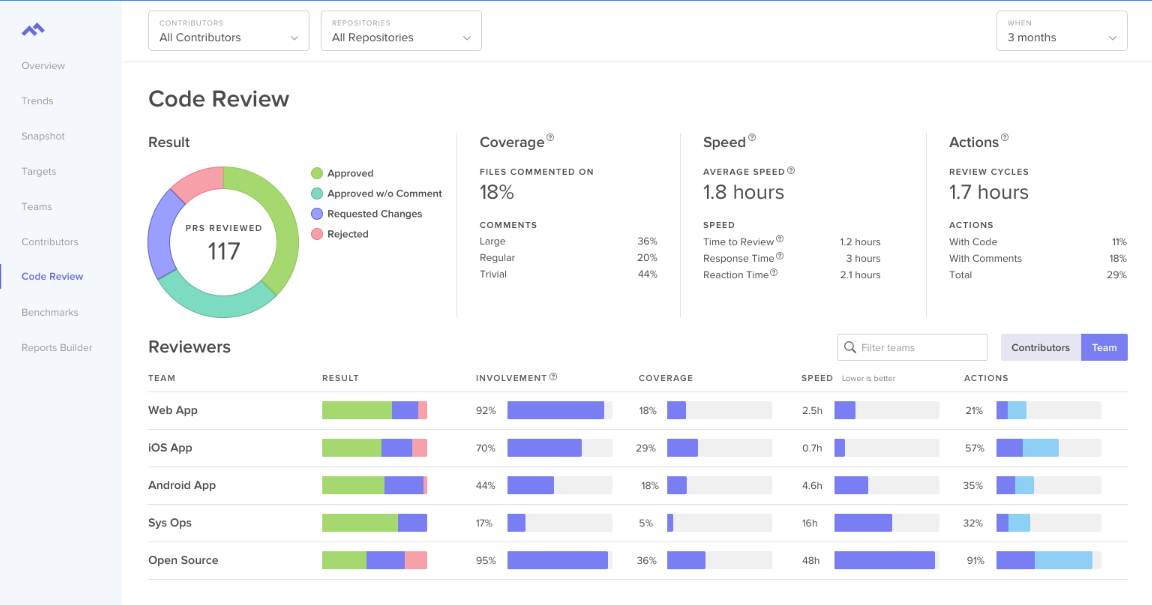
Roger did a deeper evaluation of the agile practices of high-performing teams. He looked at Velocity work habit metrics, such as Pull Request size, Time-to-Review, and Review Cycles (how often a Pull Request went back and forth between author and reviewer), which sparked meaningful conversations with team leads about what processes were incentivizing these habits.

Favorite Reports

Use data to develop a blueprint for Continuous Delivery practices across your entire engineering organization.

Get Started

Start Your Free 14 Day Trial Today