Resultados Digitais used data to boost the efficiency of their scaling team.

Industry: Marketing Automation
Company size: 500+
The Challenge

Leadership sensed that as engineering scaled, productivity did not.

The executive team noticed that the more people joined the engineering team, the more diminishing returns they saw. As people were hired, the rate at which stories were being completed didn’t increase as they had expected.

Rodrigo, one of the engineering managers, was tasked with improving not just the efficiency of his own team, but for the entire engineering organization, comprised of eight squads of 3-8 software engineers.

But Rodrigo hesitated to trust RD’s measurement of engineering speed. He felt that measuring based on stories (e.g., story throughput and lead time) wasn’t objective enough since their scope and size can vary. For example, a large story that involved a meaningful change to the codebase might make the team look slower while knocking out several “quick fixes” might make a team look faster.

“We wanted more precise, objective metrics to understand how we’re doing, and where we can improve.” Before trying to improve efficiency, Rodrigo wanted to find reliable metrics that would more accurately represent engineering speed.

The Solution

Concrete Velocity metrics enabled Rodrigo to find and advocate for process improvements.

When Rodrigo stumbled upon Velocity, everything clicked. He felt like Pull Requests were the first objective and accurate unit of measurement he has found for software engineering.

Rodrigo could get a sense of how fast his team was moving based on Pull Requests Merged and find patterns in Velocity that correlated with productive teams and sprints. He also looked at metrics that indicated underlying drivers of productivity, such as the number of reviews, the time to review, and revert count.

One of Rodrigo’s discoveries was that when the team pushed smaller PRs, they tended to ship features more frequently. So he and the other leaders set a new goal: no more PRs larger than 400 lines of code. “We noticed a correlation between the size of a pull request and cycle time. This led to an organization-wide emphasis on limiting the size of pull requests.”

Within three months, Resultados saw a 26% increase in pull requests merged across the organization. Rodrigo discovered a way to scale the efficiency of their growing engineering organization.

I love using pull requests as a unit of work. This Velocity metric is a real measure, not an abstraction.
Rodrigo Miguel
Platform Engineering Manager, Resultados Digitais
Results

Data drives concrete improvement.

26% increase in Pull Requests Merged

45% decrease in Cycle Time

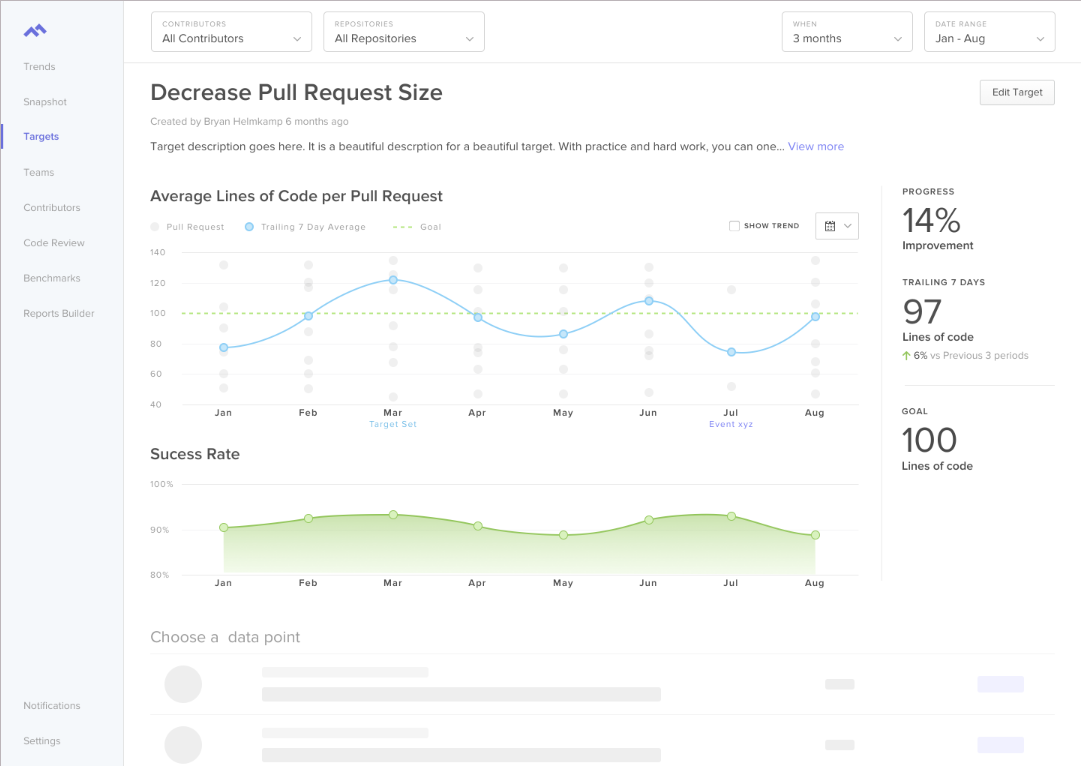
42% decrease in Pull Request Size.

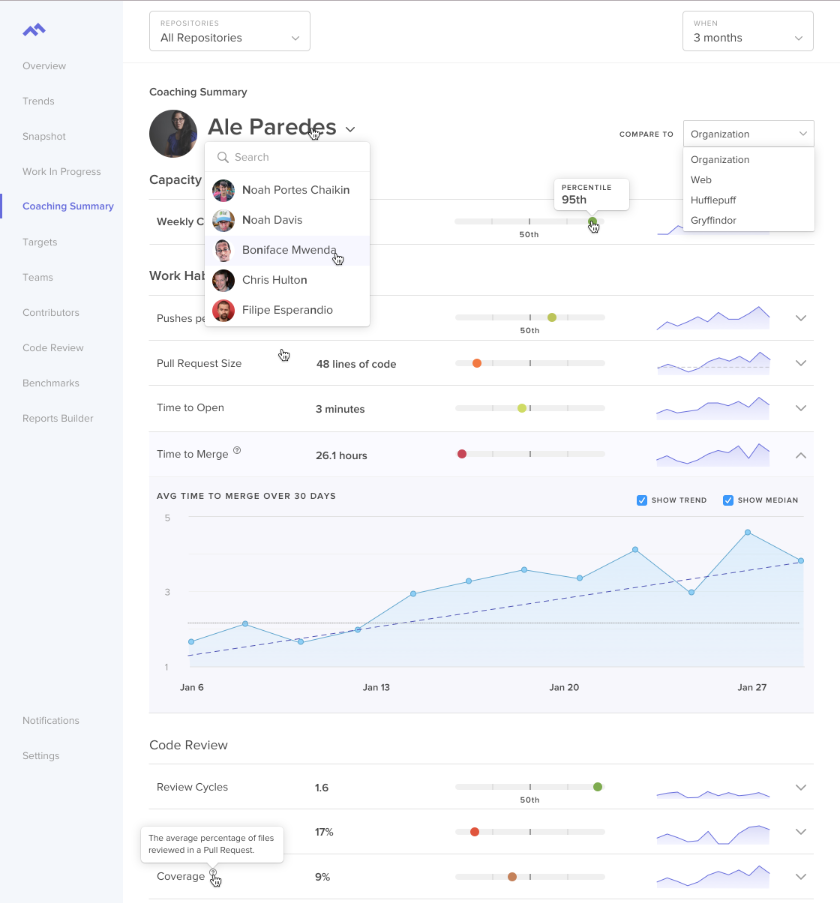
Team leaders look at Velocity together every two weeks to see where the team is doing well and where there are further opportunities for improvement. Once goals are set, individual engineers get daily emails summarizing any pull requests that are outside of the targets set. This gives everyone, from individual contributors to team leads to engineering managers an opportunity to improve the team.

Favorite Reports

Uncover your own team's inefficiencies with objective data.

Get Started

Start Your Free 14 Day Trial Today